Debugging Frontend Pages by Using DevTools
The Web component supports debugging of web frontend pages by using DevTools, a web frontend development and debugging tool that allows you to debug an application's frontend pages on a PC. Before you do this, use setWebDebuggingAccess() to enable frontend page debugging for the Web component.
To use DevTools for frontend page debugging, perform the following steps:
-
Enable web frontend page debugging in the application code.
// xxx.ets import web_webview from '@ohos.web.webview'; @Entry @Component struct WebComponent { controller: web_webview.WebviewController = new web_webview.WebviewController(); aboutToAppear() { // Enable web frontend page debugging. web_webview.WebviewController.setWebDebuggingAccess(true); } build() { Column() { Web({ src: 'www.example.com', controller: this.controller }) } } } -
Connect your device to a PC, and configure port mapping on the PC as follows:
// Configure port mapping. hdc fport tcp:9222 tcp:9222 // View port mapping. hdc fport ls -
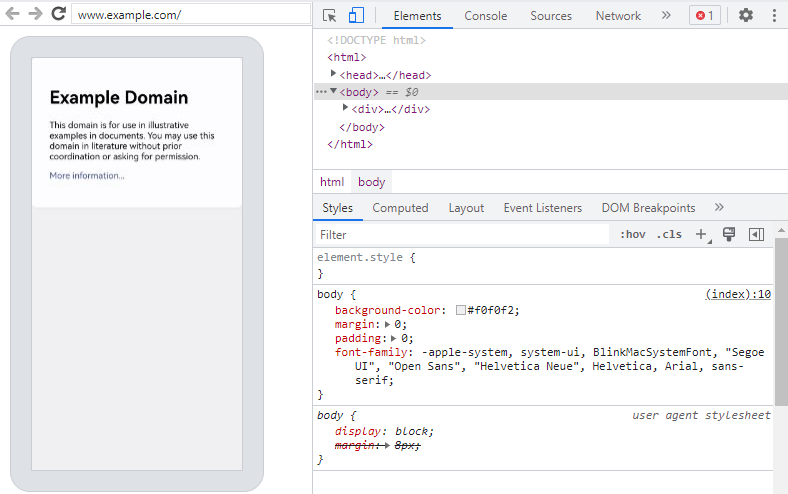
Enter chrome://inspect/#devices in the address box of the Chrome browser on the PC. Once the device is identified, you can get started with page debugging. The debugging effect is as follows:
Figure 1 Page debugging effect