chart
图表组件,用于呈现线形图、柱状图、量规图界面。
权限列表
无
子组件
不支持。
属性
除支持通用属性外,还支持如下属性:
图表参数设置,柱状图和线形图必须设置参数设置,量规图不生效。可以设置x轴、y轴的最小值、最大值、刻度数、是否显示,线条宽度、是否平滑等。(不支持动态修改) |
||||
Array<ChartDataset> |
||||
DataSegment | Array<DataSegment> |
Array<DataSegment>针对占比类图标使用,DataSegment最多9个。 |
|||
表 1 ChartOptions
表 2 ChartDataset
Array<number> | Array<Point>5+ |
||||
表 3 ChartAxis
表 4 ChartSeries
表 5 ChartLineStyle
表 6 PointStyle
|
||||
表 7 ChartLoop
擦除点的个数(最新绘制的点与最老的点之间的横向距离)。注意:轻量设备margin和topPoint/bottomPoint/headPoint同时使用时,有概率出现point正好位于擦除区域的情况,导致point不可见,因此不建议同时使用。 |
||||
表 8 Point5+
表示绘制当前线段虚线的样式。“dashed, 5, 5”表示纯虚线,绘制5px的实线后留5px的空白。“solid”表示绘制实线。 |
||||
表 9 DataSegment5+
起始位置的颜色,设置startColor必须设置endColor。不设置startColor时,会使用系统默认预置的颜色数组,具体颜色值见下表。 |
||||
当类型为量规图时,还支持如下属性:
样式
除支持通用样式外,还支持如下样式:
量规组件刻度条中心位置,该样式优先于通用样式的position样式。该样式需要和center-y和radius一起配置才能生效。(仅量规图支持) |
||||
量规组件刻度条中心位置,该样式优先于通用样式的position样式。该样式需要和center-x和radius一起配置才能生效。(仅量规图支持) |
||||
量规组件刻度条半径,该样式优先于通用样式的width和height样式。该样式需要和center-x和center-y一起配置才能生效。(仅量规图支持) |
||||
表示绘制注释的字体样式,支持自定义字体。 |
||||
事件
支持通用事件。
方法
除支持通用方法外,还支持如下方法:
|
serial: number, // 设置要更新的线形图数据下标 |
往已有的数据序列中动态添加数据,根据serial指定目标序列,serial为datasets数组的下标,从0开始。注意:不会更新datasets[index].data。仅线形图支持,按横坐标加1递增(与xAxis min/max设置相关)。 |
示例
-
线形图
<!-- xxx.hml -->
<div class="container">
  <stack class="chart-region">
    <image class="chart-background" src="common/background.png"></image>
    <chart class="chart-data" type="line" ref="linechart" options="{{lineOps}}" datasets="{{lineData}}"></chart>
  </stack>
  <button value="Add data" onclick="addData"></button>
</div>
/* xxx.css */ .container { flex-direction: column; justify-content: center; align-items: center; } .chart-region { height: 400px; width: 700px; } .chart-background { object-fit: fill; } .chart-data { width: 700px; height: 600px; } button { width: 100%; height: 50px; background-color: #F4F2F1; text-color: #0C81F3; }// xxx.js export default { data: { lineData: [ { strokeColor: '#0081ff', fillColor: '#cce5ff', data: [763, 550, 551, 554, 731, 654, 525, 696, 595, 628, 791, 505, 613, 575, 475, 553, 491, 680, 657, 716], gradient: true, } ], lineOps: { xAxis: { min: 0, max: 20, display: false, }, yAxis: { min: 0, max: 1000, display: false, }, series: { lineStyle: { width: "5px", smooth: true, }, headPoint: { shape: "circle", size: 20, strokeWidth: 5, fillColor: '#ffffff', strokeColor: '#007aff', display: true, }, loop: { margin: 2, gradient: true, } } }, }, addData() { this.$refs.linechart.append({ serial: 0, data: [Math.floor(Math.random() * 400) + 400] }) } }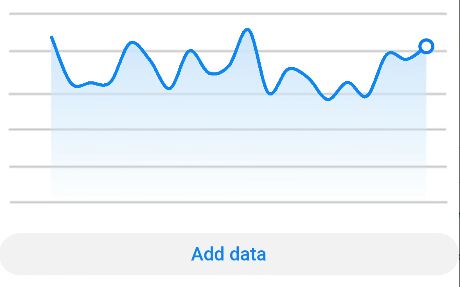
-
柱状图
<!-- xxx.hml -->
<div class="container">
  <stack class="data-region">
    <image class="data-background" src="common/background.png"></image>
    <chart class="data-bar" type="bar" id="bar-chart" options="{{barOps}}" datasets="{{barData}}"></chart>
  </stack>
</div>
/* xxx.css */ .container { flex-direction: column; justify-content: center; align-items: center; } .data-region { height: 400px; width: 700px; } .data-background { object-fit: fill; } .data-bar { width: 700px; height: 400px; }// xxx.js export default { data: { barData: [ { fillColor: '#f07826', data: [763, 550, 551, 554, 731, 654, 525, 696, 595, 628], }, { fillColor: '#cce5ff', data: [535, 776, 615, 444, 694, 785, 677, 609, 562, 410], }, { fillColor: '#ff88bb', data: [673, 500, 574, 483, 702, 583, 437, 506, 693, 657], }, ], barOps: { xAxis: { min: 0, max: 20, display: false, axisTick: 10, }, yAxis: { min: 0, max: 1000, display: false, }, }, } }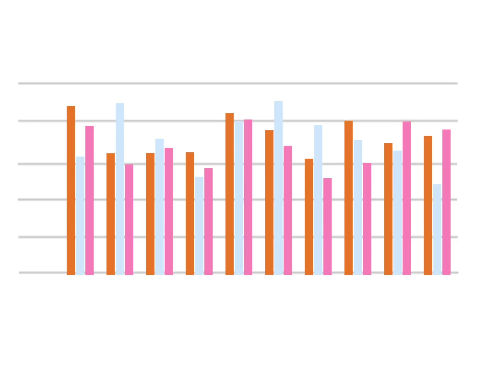
-
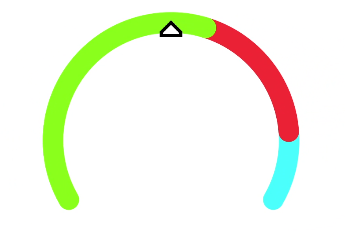
量规图
<!-- xxx.hml -->
<div class="container">
  <div class="gauge-region">
    <chart class="data-gauge" type="gauge" percent = "50"></chart>
  </div>
</div>
/* xxx.css */ .container { flex-direction: column; justify-content: center; align-items: center; } .gauge-region { height: 400px; width: 400px; } .data-gauge { colors: #83f115, #fd3636, #3bf8ff; weights: 4, 2, 1; }