SmartPerf User Guide
Overview
Performance testing helps developers detect the performance bottlenecks and deliver quality applications that meet user expectations. For this reason, SmartPerf, a performance testing tool specially designed for OpenHarmony developers, is provided.
Introduction
SmartPerf is a reliable, easy-to-use performance and power consumption test tool built for the OpenHarmony system. It provides KPIs with test value details that help you measure the performance and power consumption of your application, such as FPS, CPU, GPU, and Ftrace.
You can use SmartPerf in two modes: visualized operation mode (SmartPerf-Device) and command-line shell mode (SmartPerf-Daemon). SmartPerf-Device supports visualized operations and floating window based operations (such as data collection control and real-time data display). SmartPerf-Daemon is applicable to devices without screens and devices with high tolerance regarding performance, for example, Hi3568.
Principles
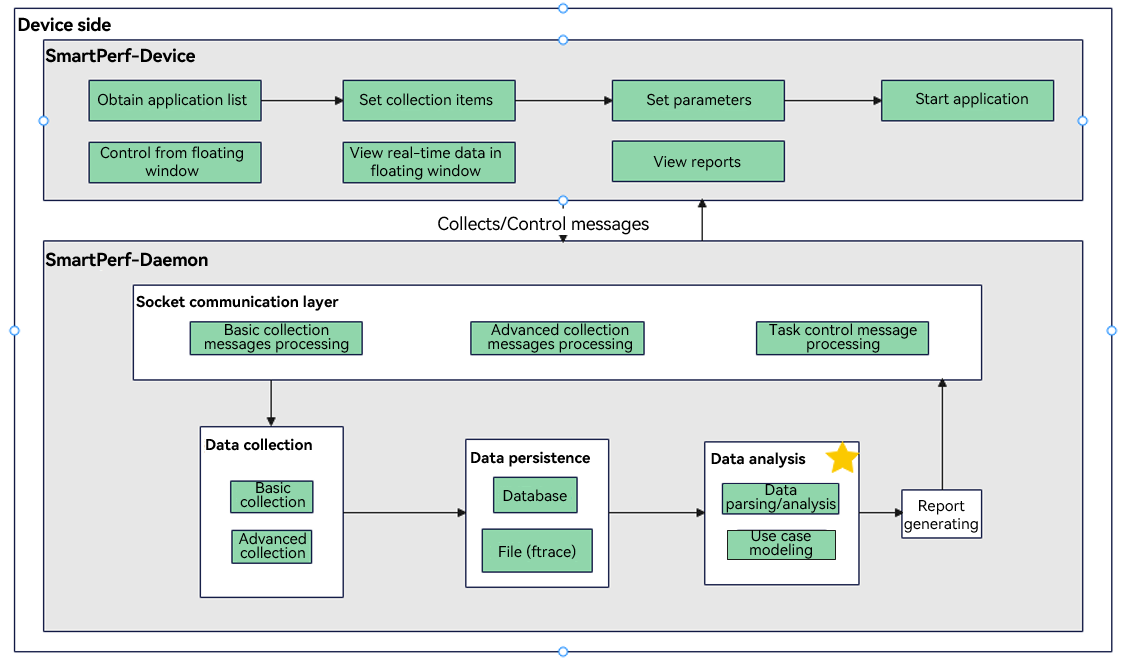
SmartPerf come with SmartPerf-Device and SmartPerf-Daemon. SmartPerf-Device sends data requests for KPIs (such as FPS, RAM, and Trace) through messages to SmartPerf-Daemon, which then collects and sends back data as requested, and displays the received data. SmartPerf-Daemon also allows on-demand data collection through hell commands. The figure below demonstrates the main functions of SmartPerf.

Constraints
- SmartPerf-Device and SmartPerf-Daemon are pre-installed in version 3.2 and later versions.
- SmartPerf-Device requires a screen to work correctly.
Environment Preparations
To run SmartPerf-Daemon, you must connect the PC to an OpenHarmony device, such as the RK3568 development board.
Performing Performance Testing
Using SmartPerf-Device
In the screenshots below, the RK3568 development board is used as an example.
-
Set the application for which you want to collect data.
Start SmartPerf-Device. On the home screen, select the test application and test indicators, and touch Start Test.
-
Control the data collection process from the floating window.
To start collection, touch Start in the floating window. To pause, touch the timer in the floating window to pause data collection. To resume, touch the timer again. To view the collected data in real time, double-touch the timer. To stop, touch and hold the timer. You can drag the floating window to anywhere you like.
-
View the report.
Touch Report to view the test report list. Touch Report List to view details about test indicators.
Using SmartPerf-Daemon
- Access the shell and run the following command to view the help information:
:# SP_daemon --help
- Run the collection commands.
:# SP_daemon -N 2 -PKG com.ohos.contacts -c -g -t -p -r
Collection Commands
| Command | Function | Mandatory |
|---|---|---|
| -N | Set the number of collection times. | Yes |
| -PKG | Set the package name. | No |
| -PID | Sets the PID of a process (applicable to RAM). | No |
| -c | Set whether to collect CPU data. | No |
| -g | Set whether to collect GPU data. | No |
| -f | Set whether to collect FPS data. | No |
| -t | Set whether to collect temperature data. | No |
| -p | Set whether to collect current data. | No |
| -r | Set whether to collect memory data. | No |
The default output path of the test result is as follows:
/data/local/tmp/data.csv