Development Toolchain
Introduction
The development toolchain subsystem provides debugging commands and tools for performance monitoring and tracing.
This subsystem provides the following tools:
- bytrace: a tool for you to trace processes and monitor performance. It encapsulates and extends the ftrace inside the kernel and supports tracing in the user space.
- hdc: a command line tool for debugging. With hdc, you can interact with real devices or simulators from Windows, Linux, or macOS.
- profiler: a performance profiling platform for you to analyze memory and performance issues.
Architecture
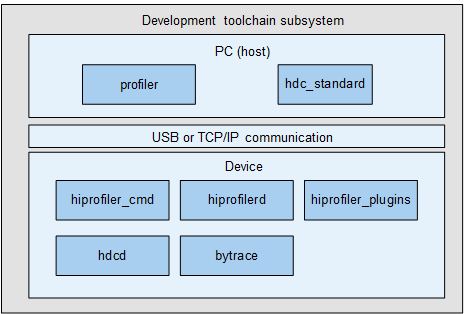
The figure below shows the architecture of the development toolchain subsystem.
Figure 1 Architecture of the development toolchain subsystem
Directory Structure
/developtools             # Development toolchain subsystem
├── bytrace_standard      # bytrace code
│   └── bin               # bytrace function implementation
│   └── innerkits         # Header files for internal subsystems
├── hdc_standard          # hdc code
│   └── src               # hdc function implementation
│   └── prebuilt          # Prebuilt code
├── profiler              # Profiler code
│   └── device            # Device code
│   └── host              # Host code
│   └── interfaces        # APIs between modules and external APIs
│   └── trace_analyzer    # bytrace analyzer code
│   └── protos            # proto files
Usage
bytrace
The table below lists the commands supported by bytrace.
Table 1 Commands supported by bytrace
Examples:
-
Query supported labels.
bytrace -l Or bytrace --list_categories -
Trace ability information for 10 seconds and store the traced data in a buffer of 4 MB.
bytrace -b 4096 -t 10 --overwrite ability > /data/mytrace.ftrace -
Set the clock type for traces to mono.
bytrace --trace_clock mono -b 4096 -t 10 --overwrite ability > /data/mytrace.ftrace -
Compress the traced data.
bytrace -z -b 4096 -t 10 --overwrite ability > /data/mytrace.ftrace
hdc
The table below lists the commands supported by hdc.
Table 2 Commands supported by hdc
Examples:
-
Send a file to a remote device.
hdc file send E:\c.txt /sdcard -
Restart a device.
hdc target boot -
Obtain log information.
hdc hilog -
Enter the interactive command mode:
hdc shell -
Set the listening socket.
hdc -s 192.168.1.100:1234 -
Restart the device in bootloader mode.
hdc target boot bootloader -
Connect to the device with a specified IP address and port number.
hdc tconn 192.168.0.100:8710
profiler
The profiler module consists of the system and application profiler frameworks. It provides a performance profiler platform for you to analyze system issues related to the memory and performance.
The profiler module provides the following capabilities:
- Capabilities for the PC: The capabilities are released as a DevEco Studio plug-in, which contains UI drawing, device management, process management, plug-in management, data import, data storage, data analysis, session management, and configuration management.
- Capabilities for the device: The capabilities include the command line tool, service processes, plug-ins, and application components. The device-side profiler provides APIs for extending plug-ins. With these APIs, you can define capabilities and integrate them into the framework. Currently, the real-time memory analysis and trace plug-ins are available. For details, see the profiler readme.
Repositories Involved
Development Toolchain Subsystem