SmartPerf User Guide
Introduction
SmartPerf is a reliable, easy-to-use performance and power consumption test tool. In this tool, you can measure the performance and power consumption of your application with quantitative indicators, such as FPS, CPU, GPU, RAM, and Temp.
Targeted at devices with or without screens, SmartPerf provides two modes: SmartPerf-Device and SmartPerf-Daemon.
- SmartPerf-Device is applicable to devices with screens and provides a visualized, intuitive UI that simplifies your operations. You can start and pause a test with a floating window, view performance data in real time, and save the test results for further analysis.
- SmartPerf-Daemon is applicable to devices with and without screens and works with shell commands.
The following are the available indicators:
- CPU: The tool reads the frequencies and usage of CPU cores on the test device on a per second basis to measure the CPU usage of the target application. Sustained high CPU may lead to overheating.
- GPU: The tool reads the GPU frequency and load information of the test device on a per second basis to measure the GPU usage of the target application. High GPU usage can lead to performance drops and application slowdowns.
- FPS: The tool reads the frame rate, in frames per second (FPS), of the target application to measure the smoothness of the application image. A higher FPS generally means smoother visuals.
- POWER: The tool reads the current and voltage of the test device on a per second basis.
- TEMP: The tool reads the temperature information of the test device on a per second basis, including the battery temperature and system chip temperature.
- RAM: The tool reads the RAM usage of the target application on a per second basis.
- snapshot: The tool takes a screenshot of the application UI every second.
Principles
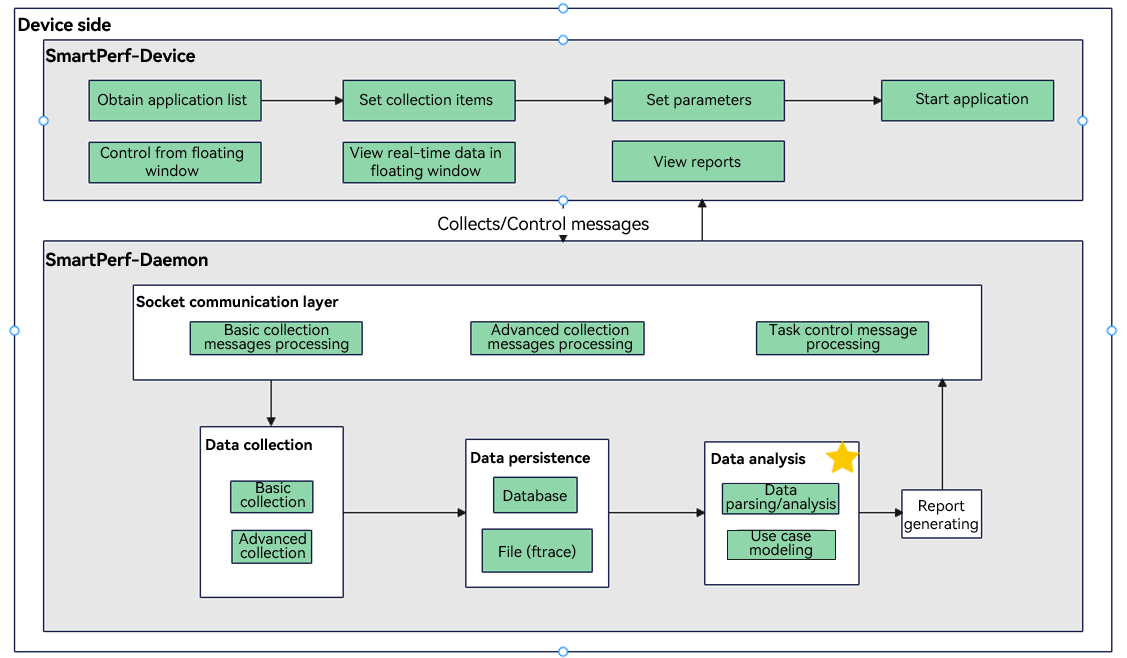
The figure below demonstrates the main functions of SmartPerf. Set data collection items and parameters on SmartPerf-Device, start the application, and then send data requests for KPIs (such as FPS, RAM, and Trace) from SmartPerf-Device to SmartPerf-Daemon through messages. SmartPerf-Daemon collects, persists, and analyzes data as requested, and then sends the data to SmartPerf-Device for display.
Constraints
-
SmartPerf-Device and SmartPerf-Daemon are pre-installed since API version 9.
-
SmartPerf-Device can only be used on devices with a screen, and SmartPerf-Daemon must be connected to a hardware device.
-
Before using SmartPerf-Daemon, configure the HDC environment.
Performing Performance Testing
SmartPerf-Device
The RK3568 development board is used as an example below.
- Obtain the application list and select an application.
Start SmartPerf-Device. On the home screen, select the target application.
- Configure test settings.
After the target application is selected, return to the start page and set the test indicators. You can also change the test name (which includes the name of the target application and the test time and will be displayed in the report), and specify whether to capture traces and whether to enable the screenshot feature. When you are done, click the start button at the bottom.
- Use the floating window to manage data collection.
To start collection, touch Start in the floating window. To pause, touch the timer in the floating window. To resume, touch the timer again. To view the collected data in real time, double-touch the timer. To stop, touch and hold the timer.
You can drag the floating window to anywhere you like.
- View test results.
Click Report to access the report list. Touch a report to view its details.
SmartPerf-Daemon
Basic Collection Commands
| Command | Function | Mandatory |
|---|---|---|
| -N | Sets the number of collection times (once per second). | Yes |
| -PKG | Sets the bundle name. | No |
| -c | Collects the CPU frequency and usage. If the application bundle name is set, the collected information covers both the system and the target application. If the application bundle name is not set, the collected information covers the system only. | No |
| -g | Collects the GPU frequency and load information. | No |
| -f | Collects the frame rate of the target application. The application bundle name must be specified. | No |
| -profilerfps | Collects the frame rate of the current page. | No |
| -t | Collects temperature information. | No |
| -p | Collects current and voltage information. | No |
| -r | Collects the RAM usage. If the application bundle name is set, the collected information covers both the system and the target application. If the application bundle name is not set, the collected information covers the system only. | No |
| -snapshot | Takes screenshots. | No |
| -net | Collects the network speed. | No |
| -VIEW | Sets the view layer. You must obtain the layer name first. | No |
| -screen | Collects the screen resolution and refresh rate. | No |
Commands for Starting or Stopping Data Collection
| Command | Function | Mandatory |
|---|---|---|
| -start | Starts collection. This command can be followed by basic collection commands. | Yes |
| -stop | Stops collection. A report is generated when collection is complete. | Yes |
Example
- Run the Win + R command to open the command-line interface (CLI).
C:\Users\issusser>hdc shell  // Example
#
- Start the daemon process.
C:\Users\issusser>hdc shell
# SP_daemon
#
- Check whether the daemon process is running.
C:\Users\issusser>hdc shell
# SP_daemon
# ps -ef | grep SP_daemon
root          1584     1 0 21:50:05 ?     00:00:00 SP_daemon
root          1595  1574 3 21:51:02 pts/0 00:00:00 grep SP_daemon
#
- View the help information.
# SP_daemon --help
usage: SP_daemon <options> <arguments>
--------------------------------------------------------------------
These are common commands list:
-N             set the collection times, for example: -N 10
-PKG           set package name, must add, for example: -PKG ohos.samples.ecg
-c             get device cpuFreq and cpuUsage, process cpuUsage and cpuLoad ..
-g             get device gpuFreq and gpuLoad
-f             get app refresh fps and fps jitters
-t             get soc-temp gpu-temp ..
-p             get current_now and voltage_now
-r             get process memory and total memory ..
-snapshot      get screen capture
-net           get networkUp and networkDown
-start         collection start command
-stop          collection stop command
-VIEW          set layer, for example: -VIEW DisplayNode
-profilerfps   get refresh fps and timestamp
-screen        get screen resolution
--------------------------------------------------------------------
Example 1: SP_daemon -N 20 -c -g -t -p -r -net -snapshot
--------------------------------------------------------------------
---------------------------------------------------------------------------------------
Example 2: SP_daemon -N 20 -PKG ohos.samples.ecg -c -g -t -p -f -r -net -snapshot
---------------------------------------------------------------------------------------
-------------------------------
Example 3: SP_daemon -start -c
-------------------------------
-------------------------------
Example 4: SP_daemon -stop
-------------------------------
-------------------------------
Example 5: SP_daemon -screen
-------------------------------

command exec finished!
#
- Run the collection commands.
5.1 Collect twice the frequency and usage of CPU cores.
# SP_daemon -N 2 -c

order:0 timestamp=1501923846459
order:1 cpu0Frequency=408000
order:2 cpu0Usage=7.142857
order:3 cpu0idleUsage=92.857143
order:4 cpu0ioWaitUsage=0.000000
order:5 cpu0irqUsage=0.000000
order:6 cpu0niceUsage=0.000000
order:7 cpu0softIrqUsage=0.000000
order:8 cpu0systemUsage=5.102041
order:9 cpu0userUsage=2.040816
...

command exec finished!
#
5.2 Collect twice the frequency and usage of CPU cores and CPU usage and load of processes.
# SP_daemon -N 2 -PKG ohos.samples.ecg -c

order:0 timestamp=1705043036099
order:1 ProcAppName=ohos.samples.ecg
order:2 ProcCpuLoad=0.008766
order:3 ProcCpuUsage=0.025100
order:4 ProcId=8815
order:5 ProcSCpuUsage=0.000000
order:6 ProcUCpuUsage=0.025100
order:7 cpu0Frequency=1430000
order:8 cpu0Usage=29.032258
order:9 cpu0idleUsage=70.967742
order:10 cpu0ioWaitUsage=0.000000
order:11 cpu0irqUsage=2.150538
order:12 cpu0niceUsage=0.000000
order:13 cpu0softIrqUsage=0.000000
order:14 cpu0systemUsage=15.053763
order:15 cpu0userUsage=11.827957
...

command exec finished!
#
NOTE
- Make sure you are on the application screen when running this command.
5.3 Collect once the GPU frequency and load of the system.
# SP_daemon -N 1 -g

order:0 timestamp=1705041456507
order:1 gpuFrequency=279000000
order:2 gpuLoad=12.000000

command exec finished!
#
5.4 Collect twice the system temperature.
# SP_daemon -N 2 -t

order:0 timestamp=1705042469378
order:1 Battery=36.000000
order:2 shell_back=38.962000
order:3 shell_frame=37.962000
order:4 shell_front=42.663000
order:5 soc_thermal=48.645000
order:6 system_h=38.277000

order:0 timestamp=1705042470389
order:1 Battery=36.000000
order:2 shell_back=38.962000
order:3 shell_frame=37.962000
order:4 shell_front=42.663000
order:5 soc_thermal=48.486000
order:6 system_h=38.277000

command exec finished!
#
5.5 Collect once the current and voltage of the system.
# SP_daemon -N 1 -p

order:0 timestamp=1705041491090
order:1 currentNow=-255
order:2 voltageNow=4377614

command exec finished!
#
5.6 Collect twice the memory information of the system.
# SP_daemon -N 2 -r
order:0 timestamp=1705041562521
order:1 memAvailable=7339224
order:2 memFree=7164708
order:3 memTotal=11641840

order:0 timestamp=1705041563527
order:1 memAvailable=7339136
order:2 memFree=7164684
order:3 memTotal=11641840

command exec finished!
#
5.7 Collect twice the memory information of the system and the target application process.
# SP_daemon -N 2 -PKG ohos.samples.ecg -r

order:0 timestamp=1705041668525
order:1 memAvailable=7350856
order:2 memFree=7166896
order:3 memTotal=11641840
order:4 pss=107232

order:0 timestamp=1705041669527
order:1 memAvailable=7350852
order:2 memFree=7166896
order:3 memTotal=11641840
order:4 pss=107232

command exec finished!
#
NOTE
- Make sure you are on the application screen when running this command.
5.8 Take two screenshots.
# SP_daemon -N 2 -snapshot

order:0 timestamp=1705041753321
order:1 capture=data/local/tmp/capture/screenCap_1705041753321.png

/data/local/tmp/capture created!

order:0 timestamp=1705041754324
order:1 capture=data/local/tmp/capture/screenCap_1705041754324.png

command exec finished!
#
NOTE
When the collection is complete, you can view the screenshots in data/local/tmp/capture.
To export the screenshots to drive D, open a new CLI and run the *hdc file recv data/local/tmp/screenCap_1700725192774.png D:* command.
5.9 Collect twice the network speeds.
# SP_daemon -N 2 -net

order:0 timestamp=1705041904832
order:1 networkDown=0
order:2 networkUp=0

order:0 timestamp=1705041905870
order:1 networkDown=22931
order:2 networkUp=2004

command exec finished!
#
5.10 Collect the frame rate of the target application five times.
# SP_daemon -N 5 -PKG ohos.samples.ecg -f

order:0 timestamp=1705306472232
order:1 fps=43
order:2 fpsJitters=602261688;;8352083;;8267708;;8305209;;8298437;;8308854;;8313542;;8569271;;8061458;;8300521;;8308333;;8309896;;8429167;;8241667;;8258333;;8318229;;8312500;;8304167;;41760937;;16418750;;8298959;;8319270;;8308334;;8313541;;8302605;;8320312;;8298958;;8326042;;8321354;;8301042;;8310417;;8309895;;8308855;;8331250;;8286458;;8343229;;8278125;;8311458;;8306250;;8312500;;8320834;;8346875;;8283333

order:0 timestamp=1705306473234
order:1 fps=40
order:2 fpsJitters=674427313;;8191145;;8310417;;8319271;;8301562;;8318750;;8302084;;8314062;;8333334;;8283854;;8307812;;8311979;;8310417;;8307813;;8309375;;8323958;;8306250;;8308333;;8317709;;8296875;;8721875;;7895833;;8320833;;8340625;;8276563;;8409896;;8216145;;8310938;;8301042;;8362500;;8252604;;8317708;;8376042;;8256250;;8292187;;8303125;;8313542;;8310417;;8520312;;8109375
...
command exec finished!
#
NOTE
- When running this command, make sure you are on the application screen, and then swipe on the screen or switch between screens.
5.11 Collect the frame rate of the specified view layer of the target application for five times.
-
Obtain the view layer name.
# hidumper -s 10 -a surface | grep surface surface [DisplayNode] NodeId[6781753360410] LayerId[10]: surface [RCDTopSurfaceNode] NodeId[6781753360412] LayerId[12]: surface [RCDBottomSurfaceNode] NodeId[6781753360411] LayerId[11]: # -
Collect the frame rate of the specified view layer.
# SP_daemon -N 10 -VIEW DisplayNode -f
order:0 timestamp=1705306822850
order:1 fps=15
order:2 fpsJitters=876291843;;8314062;;8308334;;8314583;;8310417;;8308333;;8326042;;8314583;;8292708;;8492709;;8143750;;8340104;;8294271;;8302604;;8297396

order:0 timestamp=1705306823852
order:1 fps=12
order:2 fpsJitters=906667363;;8279167;;8311458;;8315625;;8291146;;8313021;;8323438;;8293750;;8303125;;8313541;;8301563;;8317708
...
#
NOTE
Before running this command, you must obtain the application view layer name.
Replace DisplayNode following -VIEW with the obtained layer name. When running this command, make sure you are on the application screen, and then swipe on the screen or switch between screens.
5.12 Collect the full information of the system, including the CPU, GPU, temperature, current, screenshot, network speed, and memory information.
# SP_daemon -N 10 -c -g -t -p -snapshot -net -r

order:0 timestamp=1705042018276
order:1 cpu0Frequency=490000
order:2 cpu0Usage=33.000000
order:3 cpu0idleUsage=67.000000
order:4 cpu0ioWaitUsage=0.000000
order:5 cpu0irqUsage=1.000000
order:6 cpu0niceUsage=0.000000
order:7 cpu0softIrqUsage=0.000000
order:8 cpu0systemUsage=14.000000
order:9 cpu0userUsage=18.000000
...

command exec finished!
#
5.13 Collect the full information of the target application, including the CPU, GPU, temperature, current, frame rate, screenshot, network speed, and memory information.
# SP_daemon -N 10 -PKG ohos.samples.ecg -c -g -t -p -f -snapshot -net -r

order:0 timestamp=1705307489445
order:1 ProcAppName=ohos.samples.ecg
order:2 ProcCpuLoad=0.000001
order:3 ProcCpuUsage=0.000000
order:4 ProcId=13131
order:5 ProcSCpuUsage=0.000000
order:6 ProcUCpuUsage=0.000000
order:7 cpu0Frequency=418000
order:8 cpu0Usage=27.884615
order:9 cpu0idleUsage=72.115385
order:10 cpu0ioWaitUsage=0.000000
order:11 cpu0irqUsage=0.961538
order:12 cpu0niceUsage=0.000000
order:13 cpu0softIrqUsage=0.000000
order:14 cpu0systemUsage=12.500000
order:15 cpu0userUsage=14.423077
...

command exec finished!
#
5.14 Collect the frame rate of the current page.
# SP_daemon -profilerfps 10
set num:10 success
fps:82|1707125314494
fps:81|1707125534494
fps:114|1707125535494
fps:114|1707125536494
fps:115|1707125537494
fps:117|1707125538494
fps:112|1707125539494
fps:114|1707125540494
fps:111|1707125541494
fps:114|1707125542494
SP_daemon exec finished!
#
NOTE
- This command must be executed separately, and its collection result is not written into the data.csv file.
5.15 Collect the frame rate by time segment.
# SP_daemon -profilerfps 100 -sectrions 10
set num:10 success
fps:73|1707125301494
sectionsFps:0|1707125301494
sectionsFps:0|1707125301594
sectionsFps:0|1707125301694
sectionsFps:40|1707125301794
sectionsFps:120|1707125301894
sectionsFps:110|1707125301994
sectionsFps:110|1707125302094
sectionsFps:110|1707125302194
sectionsFps:120|1707125302294
sectionsFps:120|1707125302394
fps:117|1707125302494
...

SP_daemon exec finished!
#
NOTE
This command must be executed separately, and its collection result is not written into the data.csv file.
Currently, up to 10 segments can be collected.
5.16 Start data collection.
# SP_daemon -start -c
SP_daemon Collection begins
command exec finished!
#
5.17 Stop data collection.
# SP_daemon -stop
SP_daemon Collection ended
Output Path: data/local/tmp/smartperf/1/t_index_info_csv
command exec finished!
#
NOTE
- The results for the start and stop command are saved to the data/local/tmp/smartperf/1/t_index_info.csv file.
- To view or export this file, see Step 6.
5.18 Obtain the screen resolution.
# SP_daemon -screen
activeMode: 1260x2720, refreshrate=120
command exec finished!
#
NOTE
activeMode indicates the current screen resolution, and refreshrate indicates the screen refresh rate.
This command must be executed separately, and its collection result is not written into the data.csv file.
- Export and view the collection results.
-
By default, the collection results are saved to /data/local/tmp/data.csv.
-
To check the path to the test result file:
# cd data/local/tmp # ls data.csv # -
To export the test result file:
hdc file recv data/local/tmp/data.csv D:\C:\Users\issusser>hdc file recv data/local/tmp/data.csv D:\ [I][2023-11-08 16:16:41] HdcFile::TransferSummary success FileTransfer finish, Size:429, File count = 1, time:6ms rate:71.50kB/s C:\Users\issusser> -
Open the data.csv file to view data.
The table below describes the data fields in the data.csv file.
| Data Field | Description | Remarks |
|---|---|---|
| cpuFrequency | CPU core frequency. | Unit: Hz |
| cpuUasge | CPU core usage. | % |
| cpuidleUsage | CPU usage in idle state. | % |
| cpuioWaitUsage | CPU usage of I/O wait. | % |
| cpuirqUsage | CPU usage of hard interrupts. | % |
| cpuniceUsage | CPU usage of user level processes with lower scheduling priority. | % |
| cpusoftIrqUsage | CPU usage of software interrupts. | % |
| cpusystemUsage | CPU usage in kernel mode. | % |
| cpuuserUsage | CPU usage in user mode. | % |
| ProcId | PID. | |
| ProcAppName | Application name. | |
| ProcCpuLoad | Process CPU load. | % |
| ProcCpuUsage | CPU usage of the process. | % |
| ProcUCpuUsage | CPU usage of the process in user mode. | % |
| ProcSCpuUsage | CPU usage of the process in kernel mode. | % |
| gpuFrequ | GPU frequency of the system. | % |
| gpuLoad | GPU load of the system. | % |
| currentNow | Current value. | Unit: mA |
| voltageNow | Voltage value. | Unit: μV |
| fps | Screen refresh rate. | Unit: FPS |
| fpsJitters | Frame interval. | Unit: ns |
| networkDown | Downstream rate. | Unit: bps |
| networkUp | Uplink rate. | Unit: bps |
| shell_front | Front cover temperature. | Unit: °C |
| shell_frame | Frame temperature. | Unit: °C |
| shell_back | Rear cover temperature. | Unit: °C |
| soc_thermal | System chip temperature. | Unit: °C |
| system_h | System temperature. | Unit: °C |
| Battery | Battery temperature. | Unit: °C |
| memAvailable | Available memory of the system. | Unit: byte |
| memFree | Free memory of the system. | Unit: byte |
| memTotal | Total memory of the system. | Unit: byte |
| pss | Proportional set size (PSS) of the process. | Unit: byte |
| timeStamp | Timestamp. | Collection time. |