Debugging Frontend Pages by Using DevTools
The Web component supports debugging of web frontend pages by using DevTools, a web frontend development and debugging tool that allows you to debug an application's frontend pages on a PC. Before you do this, use setWebDebuggingAccess() to enable frontend page debugging for the Web component and make sure the test device connected to the PC runs 4.1.0 or a later version.
To use DevTools for frontend page debugging, perform the following steps:
-
Enable web frontend page debugging in the application code.
// xxx.ets import web_webview from '@ohos.web.webview'; @Entry @Component struct WebComponent { controller: web_webview.WebviewController = new web_webview.WebviewController(); aboutToAppear() { // Enable web frontend page debugging. web_webview.WebviewController.setWebDebuggingAccess(true); } build() { Column() { Web({ src: 'www.example.com', controller: this.controller }) } } } -
Declare the required permission in the module.json5 file of the application project in DevEco Studio.
"requestPermissions":[ { "name" : "ohos.permission.INTERNET" } ] -
Connect your device to a PC, and configure port mapping on the PC as follows:
// Search for the domain socket name required for DevTools. The name is related to the process ID. After the application being debugged is restarted, repeat this step to complete port forwarding. cat /proc/net/unix | grep devtools // Configure port mapping. Replace [pid] with the actual process ID. hdc fport tcp:9222 localabstract:webview_devtools_remote_[pid] // View port mapping. hdc fport ls Example: hdc shell cat /proc/net/unix | grep devtools // Display webview_devtools_remote_3458. exit hdc fport tcp:9222 localabstract:webview_devtools_remote_3458 hdc fport ls -
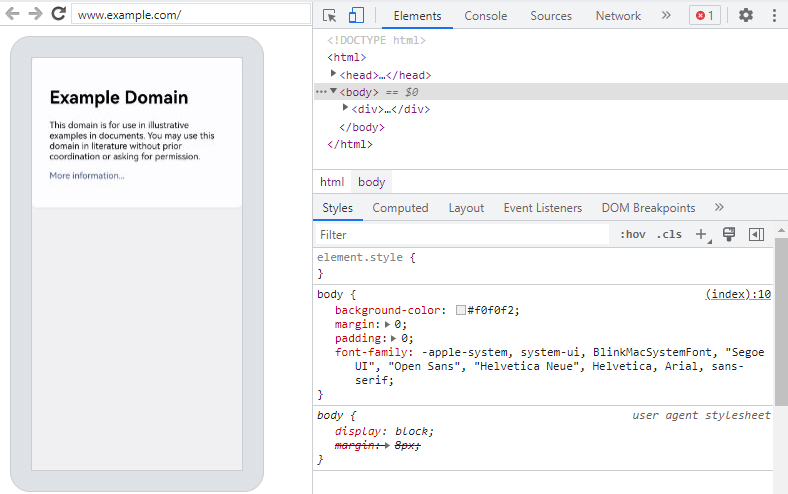
Enter chrome://inspect/#devices in the address box of the Chrome browser on the PC. Once the device is identified, you can get started with page debugging. The debugging effect is as follows:
Figure 1 Page debugging effect